So America has gotten dramatically richer.
But that leads to a different question:
Who owns it?
Spend a few minutes online and you’ll find confident answers. The rich own everything. The middle class is disappearing. The top 1% owns more than half the country. Billionaires pay nothing in taxes.
Some of those claims contain pieces of truth. Others mix different statistics together. And some become misleading because they confuse three things that sound similar but aren’t: income, wealth and taxes.
For Part 1 of Sentah’s Who Owns America? series, we’re starting with the first one.
Who actually owns America’s wealth?
First, what does “wealth” mean?
Someone earning $250,000 a year isn’t necessarily wealthy. Someone reporting relatively little taxable income in a particular year could be extremely wealthy.
Income is money received over a period of time. Wealth is what you own minus what you owe.
That can include a house, stocks, retirement accounts, businesses, cash and other assets. Mortgages, credit-card balances, student loans and other debts reduce net wealth.
Even that definition isn’t quite enough, because government researchers don’t always measure wealth the same way.
That turns out to matter enormously.
The Congressional Budget Office released an extensive analysis in 2024 examining American family wealth from 1989 through 2022. Its broadest measure includes not only conventional assets but the estimated value of future Social Security retirement and disability benefits. Under that definition, American families held approximately $199 trillion in wealth in 2022.
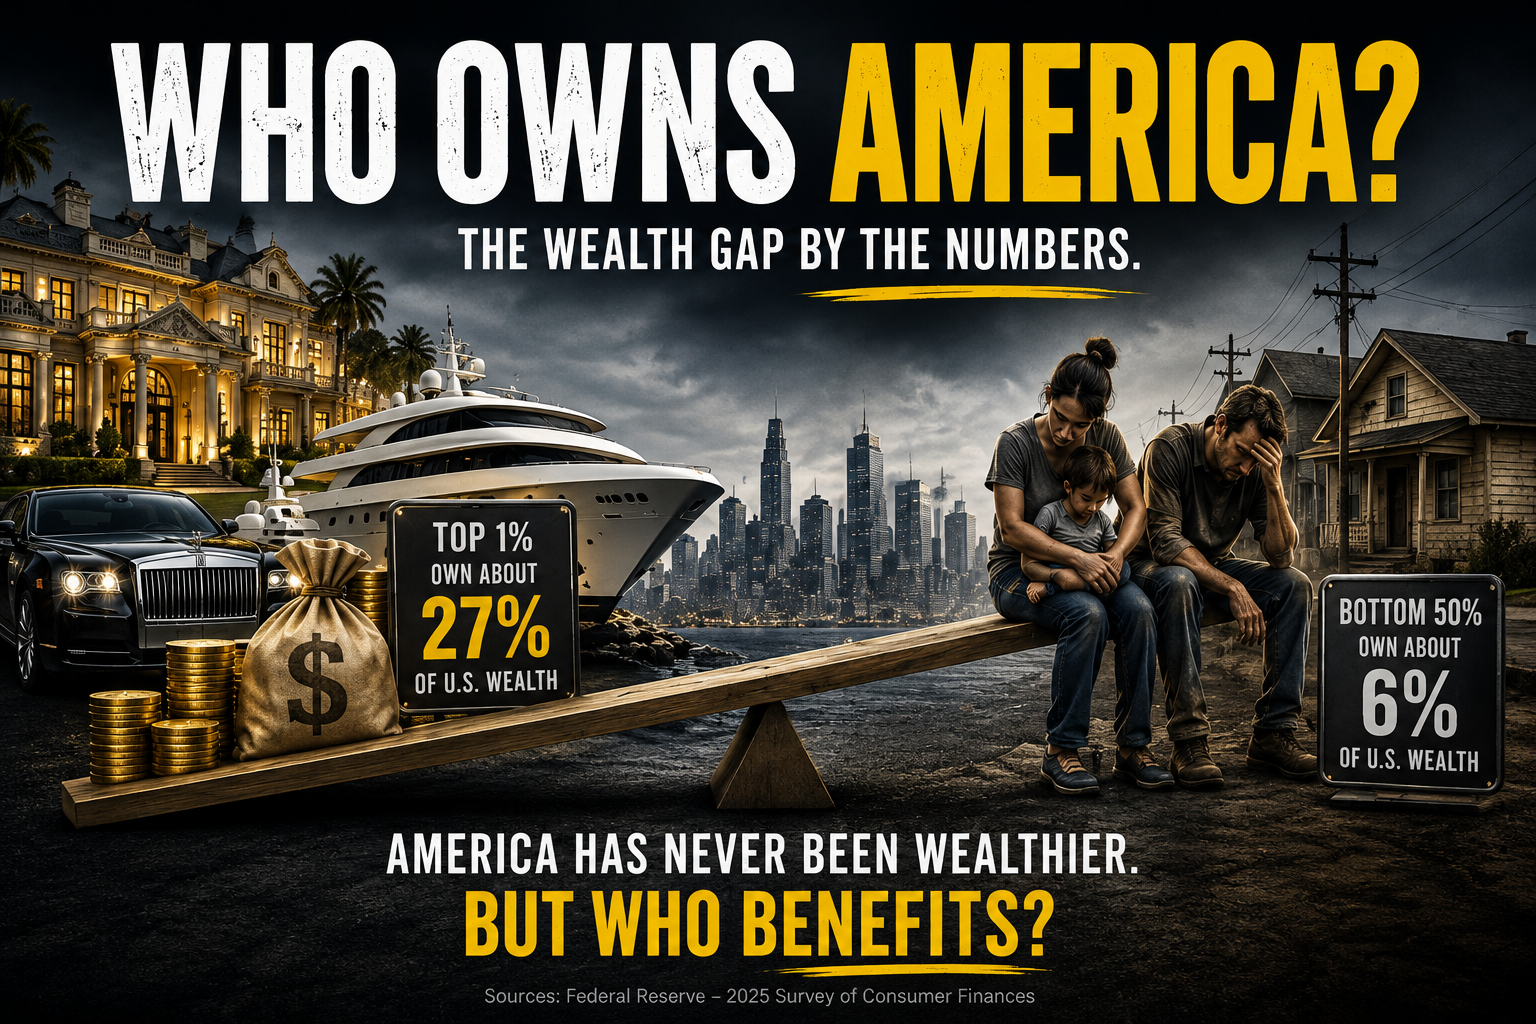
The top 10% owned 60% of it.
The top 1% alone owned 27%.
The entire bottom half of American families owned 6%.
Those numbers are already striking.
But change the definition of wealth, and the picture changes considerably.
Does the top 1% own half of everything?
Not according to the broad CBO measure.
That makes the commonly repeated claim that the top 1% “owns more than half of America’s wealth” misleading if presented without a specific definition and source.
Under CBO’s expanded measure, which includes accrued Social Security benefits, the top 1% owned 27% of family wealth in 2022. When Social Security wealth is excluded, CBO puts the top 1%’s share at approximately 33%.
That’s nowhere near half.
But that doesn’t mean wealth concentration is insignificant.
When future Social Security income is removed, CBO found that the top 10% owned 69% of American family wealth in 2022.
The bottom 50% owned just 3%.
In other words, depending on which legitimate definition is being used, the richest tenth of American families own somewhere around six to seven out of every ten dollars of family wealth.
That’s a very different claim from “the top 1% owns everything.”
It’s also extraordinary in its own right.
Why does Social Security change the numbers so much?
Because Social Security is much more important to families with relatively little conventional wealth.
CBO estimates that accrued Social Security benefits represented about 20% of total family wealth in 2022. But among families in the bottom half of the wealth distribution, Social Security accounted for more than 40% of their assets under CBO’s expanded definition. For families in the bottom quarter, it represented nearly half.
That creates an important statistical question.
Should a future stream of Social Security checks count the same way as a brokerage account, a business or a house?
There isn’t necessarily one dishonest answer.
Including Social Security captures something real: retirement benefits have economic value and can dramatically affect someone’s financial security.
But Social Security benefits aren’t an asset a family can sell tomorrow, borrow against like a house or leave to children in the same way someone can transfer stocks or a business.
That’s why Sentah will tell you which definition we’re using instead of selecting whichever number makes the most dramatic headline.
Different Americans own different kinds of wealth
The divide isn’t simply about how much people own. It’s also about what they own.
CBO found that retirement accounts and nonretirement financial assets make up larger portions of wealth among families in the upper half of the distribution. Home equity plays a larger role farther down the wealth distribution, while Social Security becomes increasingly important for families with less wealth.
Debt also matters.
Families in the bottom half have substantially more debt relative to their assets than families near the top. In 2022, about 8% of American families had negative conventional net worth—meaning their debts exceeded their marketable assets.
That helps explain why two families experiencing the same economic event can have radically different outcomes.
A booming stock market disproportionately benefits people who own substantial stocks.
Rising home prices increase the wealth of existing homeowners while simultaneously making buying a first home more difficult for people trying to enter the market.
Higher interest rates may increase returns on some financial assets while making mortgages and other borrowing substantially more expensive.
Wealth doesn’t merely represent money someone already possesses.
Wealth creates additional opportunities to accumulate wealth.
The gap has grown
The United States has long had an unequal distribution of wealth. What has changed is the degree of concentration.
Using CBO’s expanded measure, the top 1% held about 23% of family wealth in 1989. By 2022, that had increased to 27%.
The top 10% increased its share from about 56% to 60% during the same period.
Meanwhile, the bottom half’s share remained around 6%.
Using a narrower definition that excludes Social Security makes the concentration more pronounced. CBO’s earlier conventional measure found that the top 1%‘s share increased from approximately 27% in 1989 to 34% in 2019, while the bottom half’s share fell from about 4% to 2%.
Again, the numbers differ because the definitions differ.
The direction doesn’t.
American wealth has become more concentrated toward the top.
But the bottom didn’t necessarily get poorer
Here’s where the story gets more complicated.
A larger share going to the top doesn’t automatically mean everyone else lost wealth in absolute dollars.
CBO found that inflation-adjusted total family wealth increased across the distribution between 1989 and 2022. Wealth held by the top 10% increased about 306%, while wealth held by the bottom half increased about 285%.
At the 25th percentile of the wealth distribution, inflation-adjusted wealth actually increased substantially over the period. CBO found increases at the median as well.
So two statements can simultaneously be true:
Americans across much of the wealth distribution became wealthier.
And:
The richest Americans increased their control over an enormous share of the country’s wealth.
That’s precisely why slogans aren’t particularly useful here.
How much does it take to enter the top 10%?
CBO estimated that in 2022, entering the top 10% of its expanded wealth distribution required family wealth exceeding approximately $2.9 million.
The average family within that top 10% held approximately $9.1 million.
That also illustrates why “the wealthy” can be a terrible analytical category.
A retired couple with a paid-off home, retirement savings and accumulated Social Security benefits can appear in a high wealth percentile while living a life bearing little resemblance to that of a billionaire founder whose company shares are worth $50 billion.
Even the top 1% contains enormous differences between its lower boundary and its richest members.
Grouping everyone together can conceal almost as much as it reveals.
So, who owns America?
There isn’t a serious case that the top 1% literally owns most American wealth.
There is overwhelming evidence that American wealth is highly concentrated.
Depending on what is counted as wealth, the top 10% controls roughly 60% to 69% of it, while the bottom half controls roughly 3% to 6%. And the top 1%’s share has increased over the past several decades.
But those numbers answer only the first question.
They don’t tell us why the distribution looks this way.
Was it stagnant wages? Stock-market growth? Housing? Changes in tax policy? Globalization? Technology? Inheritance? Corporate ownership? Changes in who owns businesses? Some combination of all of them?
And then comes perhaps the most politically charged question of all:
If the richest Americans own such a large portion of the country’s wealth, do they also pay their fair share of the taxes?
Before answering that, we need to understand how the gap became so large in the first place.
Next in Who Owns America?
Part 2 — How the Gap Got So Wide
Sentah will examine the forces that changed the distribution of American wealth—including wages, housing, stock and business ownership, inheritance and the tax system—and separate the explanations supported by the evidence from the ones that simply make good political talking points.